Imaging with different wavelength
1. Polariscope and light color
1.1. The best wavelength for a particular polariscope?
The Polarizer (the circular polarizer between the light source and the sample) and the Analyzer (the circular polarizer between the camera and the sample) of a polariscope (transmissive or reflective) contain same type of quarter-wave plate. This quarter-wave plate sets a particular wavelength that works best for this polariscope to probe the photoelastic fringes. A different light wavelength would create larger noise, since passing the quarter-wave plates twice no longer gives a phase difference between the two perpendicular components of the light. Thus using different wavelengths can not give a perfect dark field for this polariscope.
1.2. White light or monochromatic light?
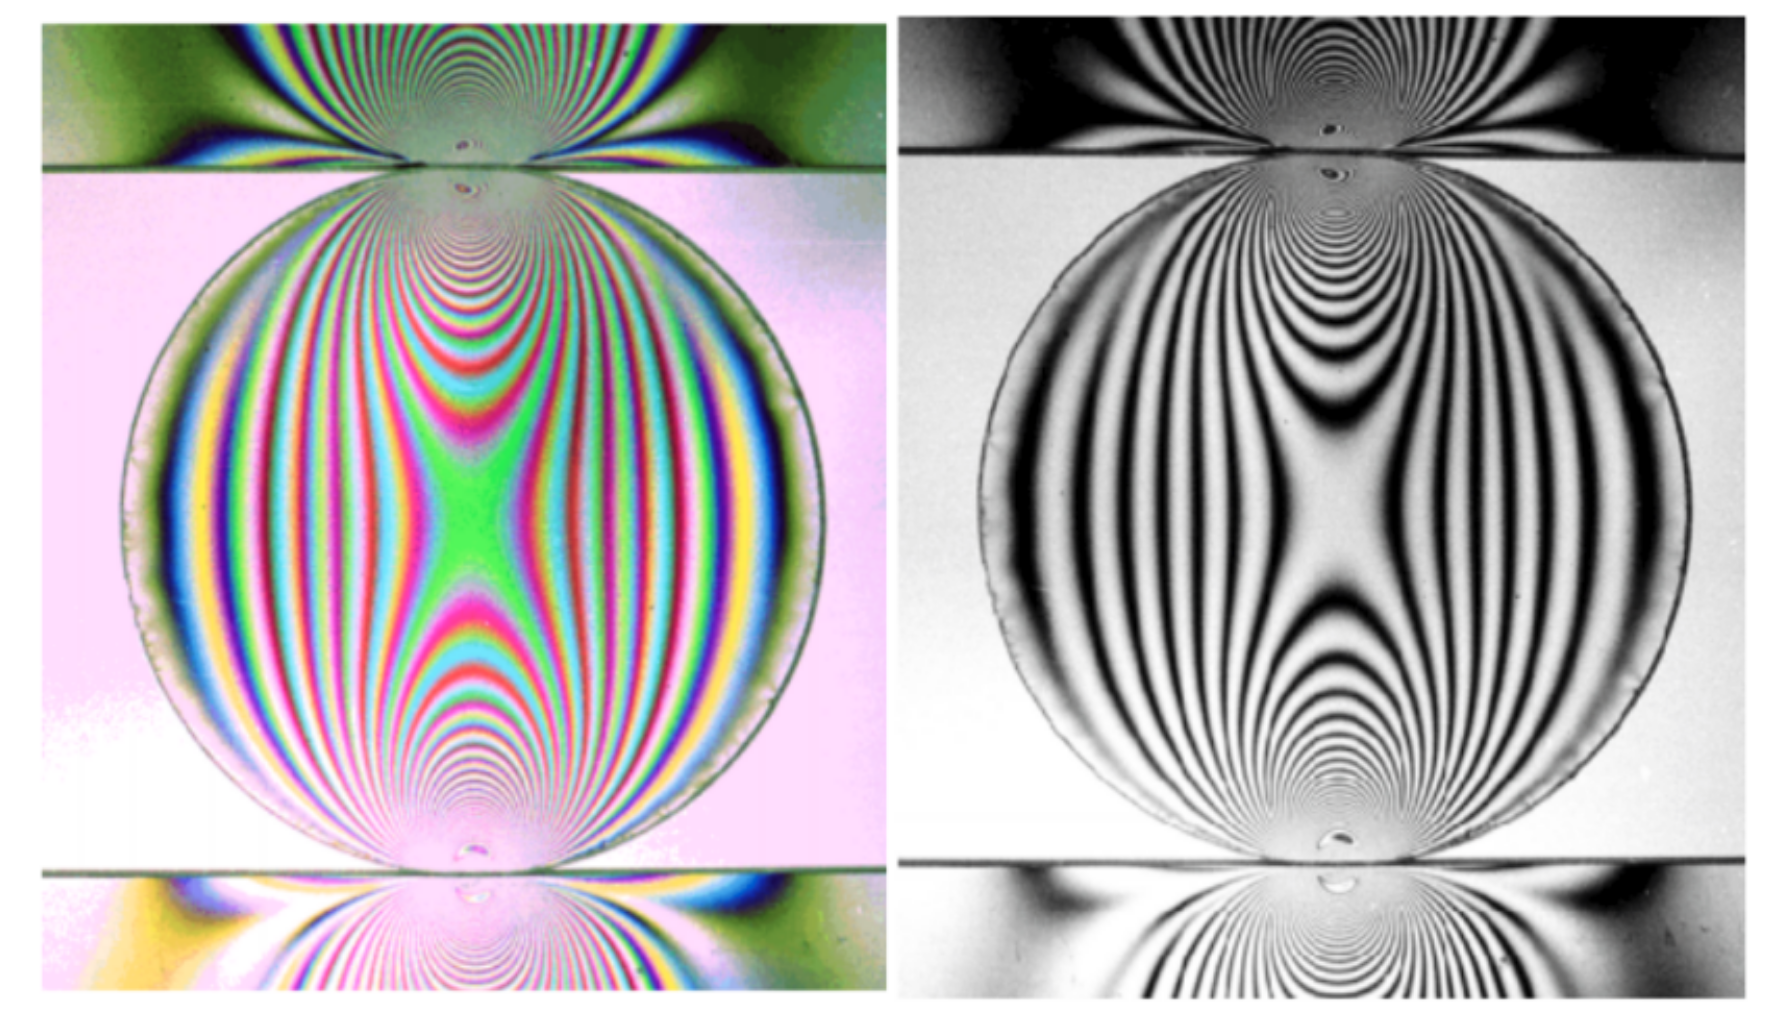
Monochromatic light works best for photoelastic fringes detection. If white light is used, the photoelastic fringes from different wavelengths will overlap with each other. A typical photoelastic image taken for a diametrically loaded disc under white light (mercury-vapor light) is shown in the left figure below. (taken from J. W. Phillips) In principle, a good light filter can isolate the fringes formed by a monochromatic light for further analysis, even if the light source was white. The right image shows the same disc under the same loading and light conditions but with a Tiffen #58 dark green filter placed on the camera lens, (taken from J. W. Phillips) showing monochromatic fringes. However, just using the green channel from the first RGB image can not give a clear pattern as the right figure, because the channel of a DSLR camera has a wide selection range (typically ~100 nm, see K. E. Daniels et al.), creating error for stress analysis. So if no good filter was available, a monochromatic light source is preferred for quantitative analysis.
2. Position detection and light color
There are two choices to record an image for position detection, where no photoelastic fringe should be visible.
-
The first choice is to use the same kind of light source but record another image without the Analyzer, which is the polarizer between the camera and the sample. An example image from this method is shown in the right figure below, where the light source is white light. (from J. Ren et al.) This method needs only one light source and avoids any possible noise caused by the photoelastic fringes on the position detection.
-
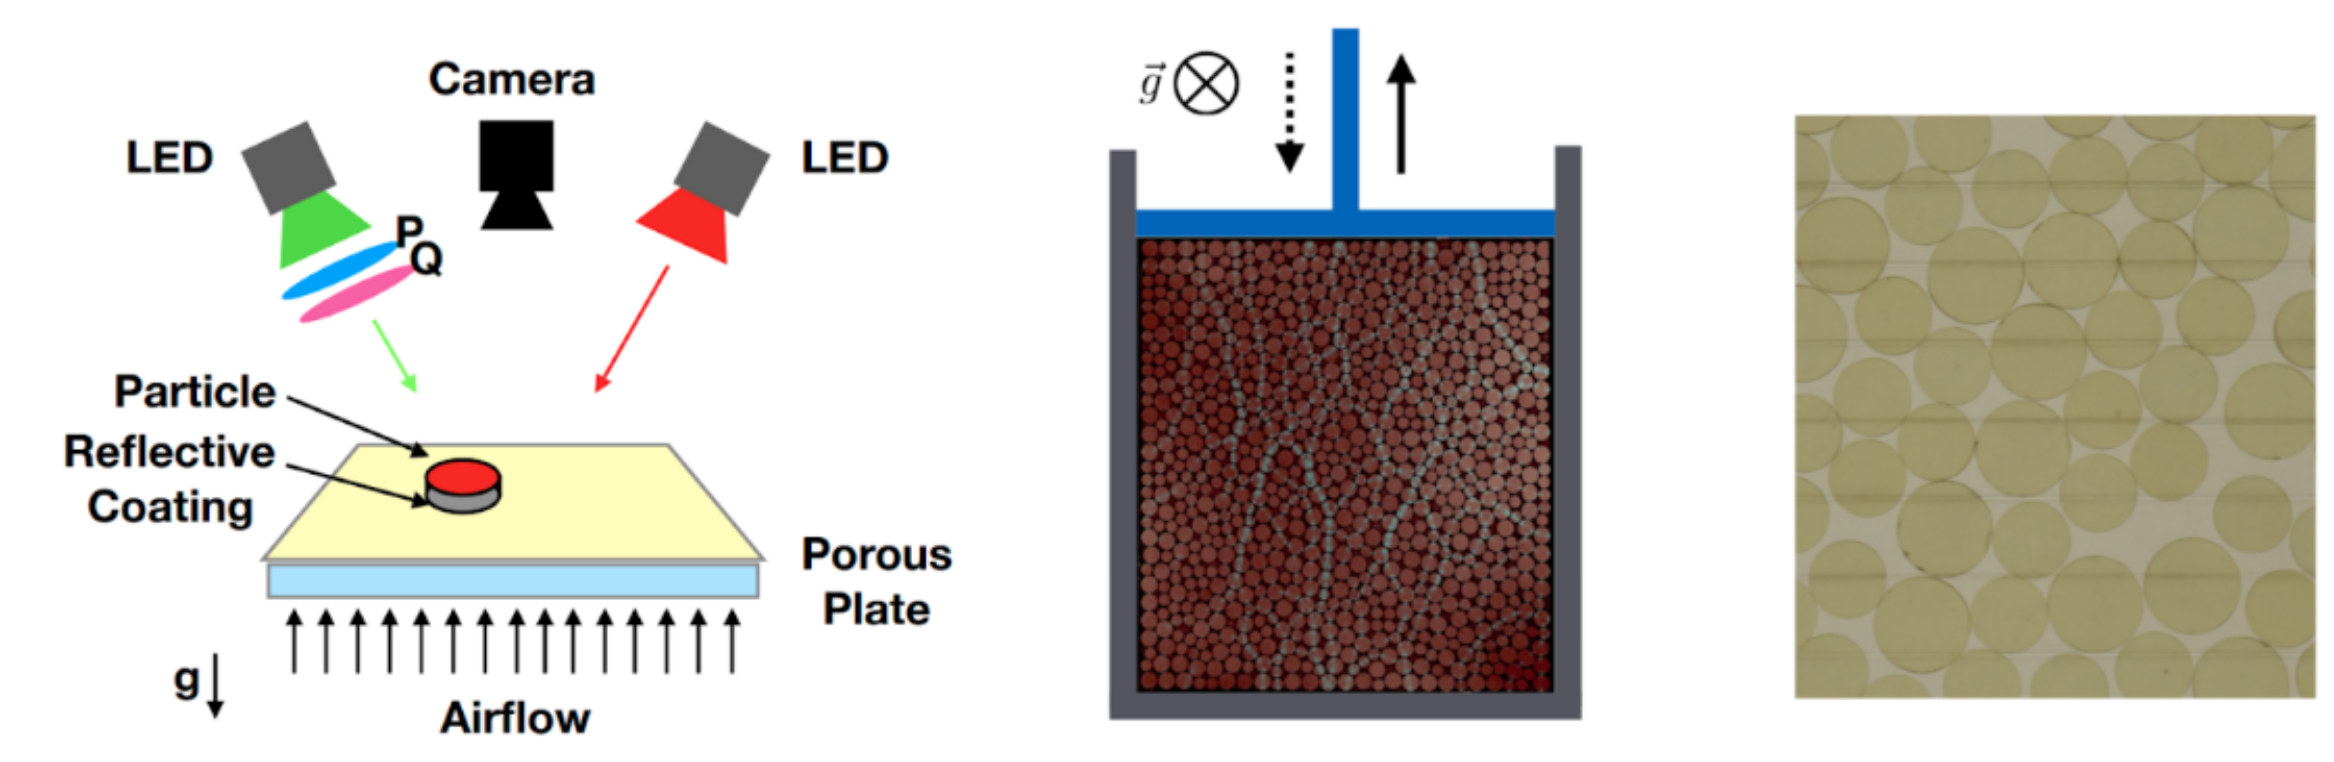
The second choice is to use another light source with a different wavelength without the Polarizer, which is the polarizer between the light source and the sample. An example setup is shown in the left figure below (from J. E. Kollmer et al.). An example image taken from this setup is shown in the middle figure below (from J. E. Kollmer et al). Only one image is enough for both position detection and the photoelastic fringes recording. The red channel of the middle image can be used for position detection and the green channel of the middle image can be used for the photoelastic stress analysis. This method saves the number of images needed to record in one experiment, which is of great practical importance: a typical DSLR camera encounters shutter problems after around 100,000 images are taken.
3. Rotation tracking and light color
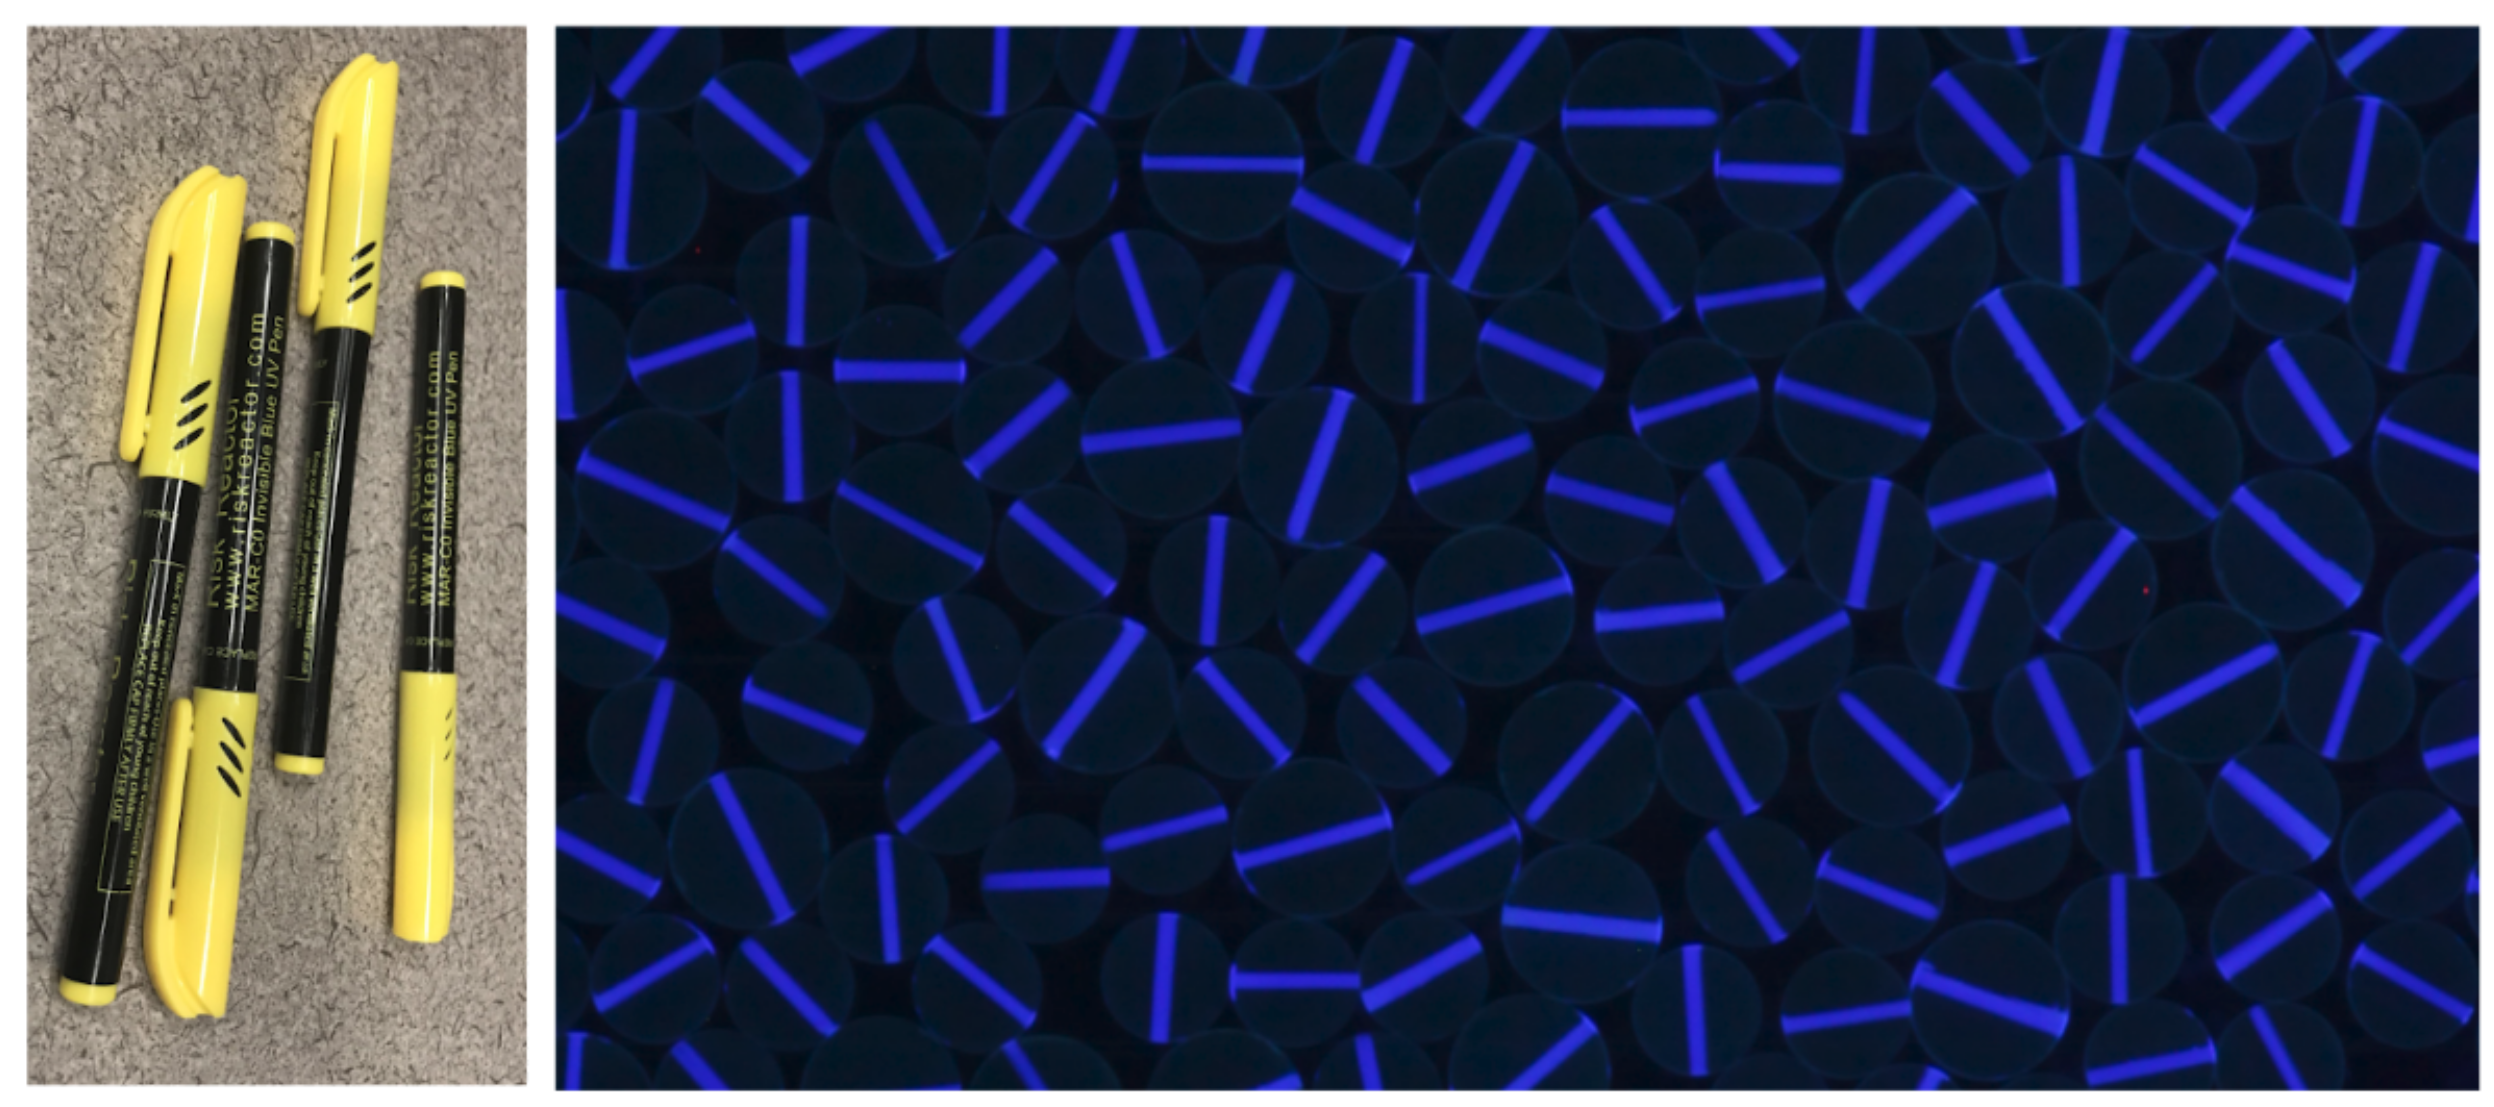
The rotation of the discs can be tracked by drawing an ultra-violet (UV) sensitive bar on them. Tracking the rotation of the bars is equal to tracking the rotation of the particles. Those labels are only visible under UV light so they will not interfere with the photoelastic fringes. The right figure below shows an image taken under UV light that shows all the UV bars on them. (from J. Ren et al.) The UV bars are plotted using MAR-C0 Invisible Blue UV Pen from Risk Reactor (left figure, more details here). UV labels can also be used to help find the center of non-spherical particles, where Hough transformation for particle boundary detection does not work.
4. Reference and further readings
[4] Phillips, James W. "Photoelasticity." Experimental Stress Analysis. Urbana (1998).
[