Detect and follow particles
Most experiments study a model 2-dimensional (2D) granular system composed of circular discs as grains. With a digital camera, the first and one of the most important information that can be obtained is the particle positions. Particle detection and tracking alone provide rich information such as particle configuration and flow field and are necessary for further measurements like force-bearing, contact detection, and contact force calculation. In this session, a detailed description of detecting particle positions and orientations and tracking particles in high-resolution images will be summarized below. In addition, in images with a resolution that is not high enough to precisely detect particle positions, another method (PIV) will be introduced.
Everything is given here for granular matter and more specifically for circular particles. However, the method we present can be easily generalized to any other sample of any shape.
1 Position and orientation detection
1.1 Detection of the particle centers from white light imaging
For particles of disc shape, a picture with white light transmitted through particles is usually taken to record their positions. The general idea to detect particles then is to produce a high contrast or a binary image distinguishing between areas occupied by particles and those by background. The procedure can be summarized as follows:
-
From one channel of the white light image that has the highest contrast between particles and background, a mapping of the intensities to new values by suppressing low and high intensities is employed to increase the contrast of the image.
-
Then a low-pass filter is applied to the Fourier transform of the image to remove noises or default impurities by setup from the background and increase contrast.
-
Finally, there are two ways to detect particles, depending on the image contrast quality. (1) If it is possible to binarize the image (1 for particles and 0 for background), then a convolution method is recommended. There are several methods to binarize an image: imbinarize function in Matlab with a fixed threshold, adaptive thresholding, and otsu method. After image binarization, a convolution is applied between the image and a pre-set disk mold whose diameter is approximately 3/4 of that of the smallest particle. The resulting convoluted image can be binarized by a threshold of 99.5% of the peak convolution value, resulting in a collection of isolated white bulbs. The centers of these bulbs correspond to the centers of particles, and their areas are related to particle diameters, which can be pre-assigned. (2) If it is too difficult to binarize the image, a circular Hough transform is recommended to be applied to the grayscale image to find the centers and diameters of the discs. The circular Hough transform is an algorithm computing the curvature at each pixel point based on the image grayscale gradient. The curvature will automatically give the center and radius. Then a voting process rules out fake circles and combines circles with close enough centers and similar radii.
The procedure described above with results at each step is illustrated in the figure below (only part of the actual image is shown here for visual purposes).
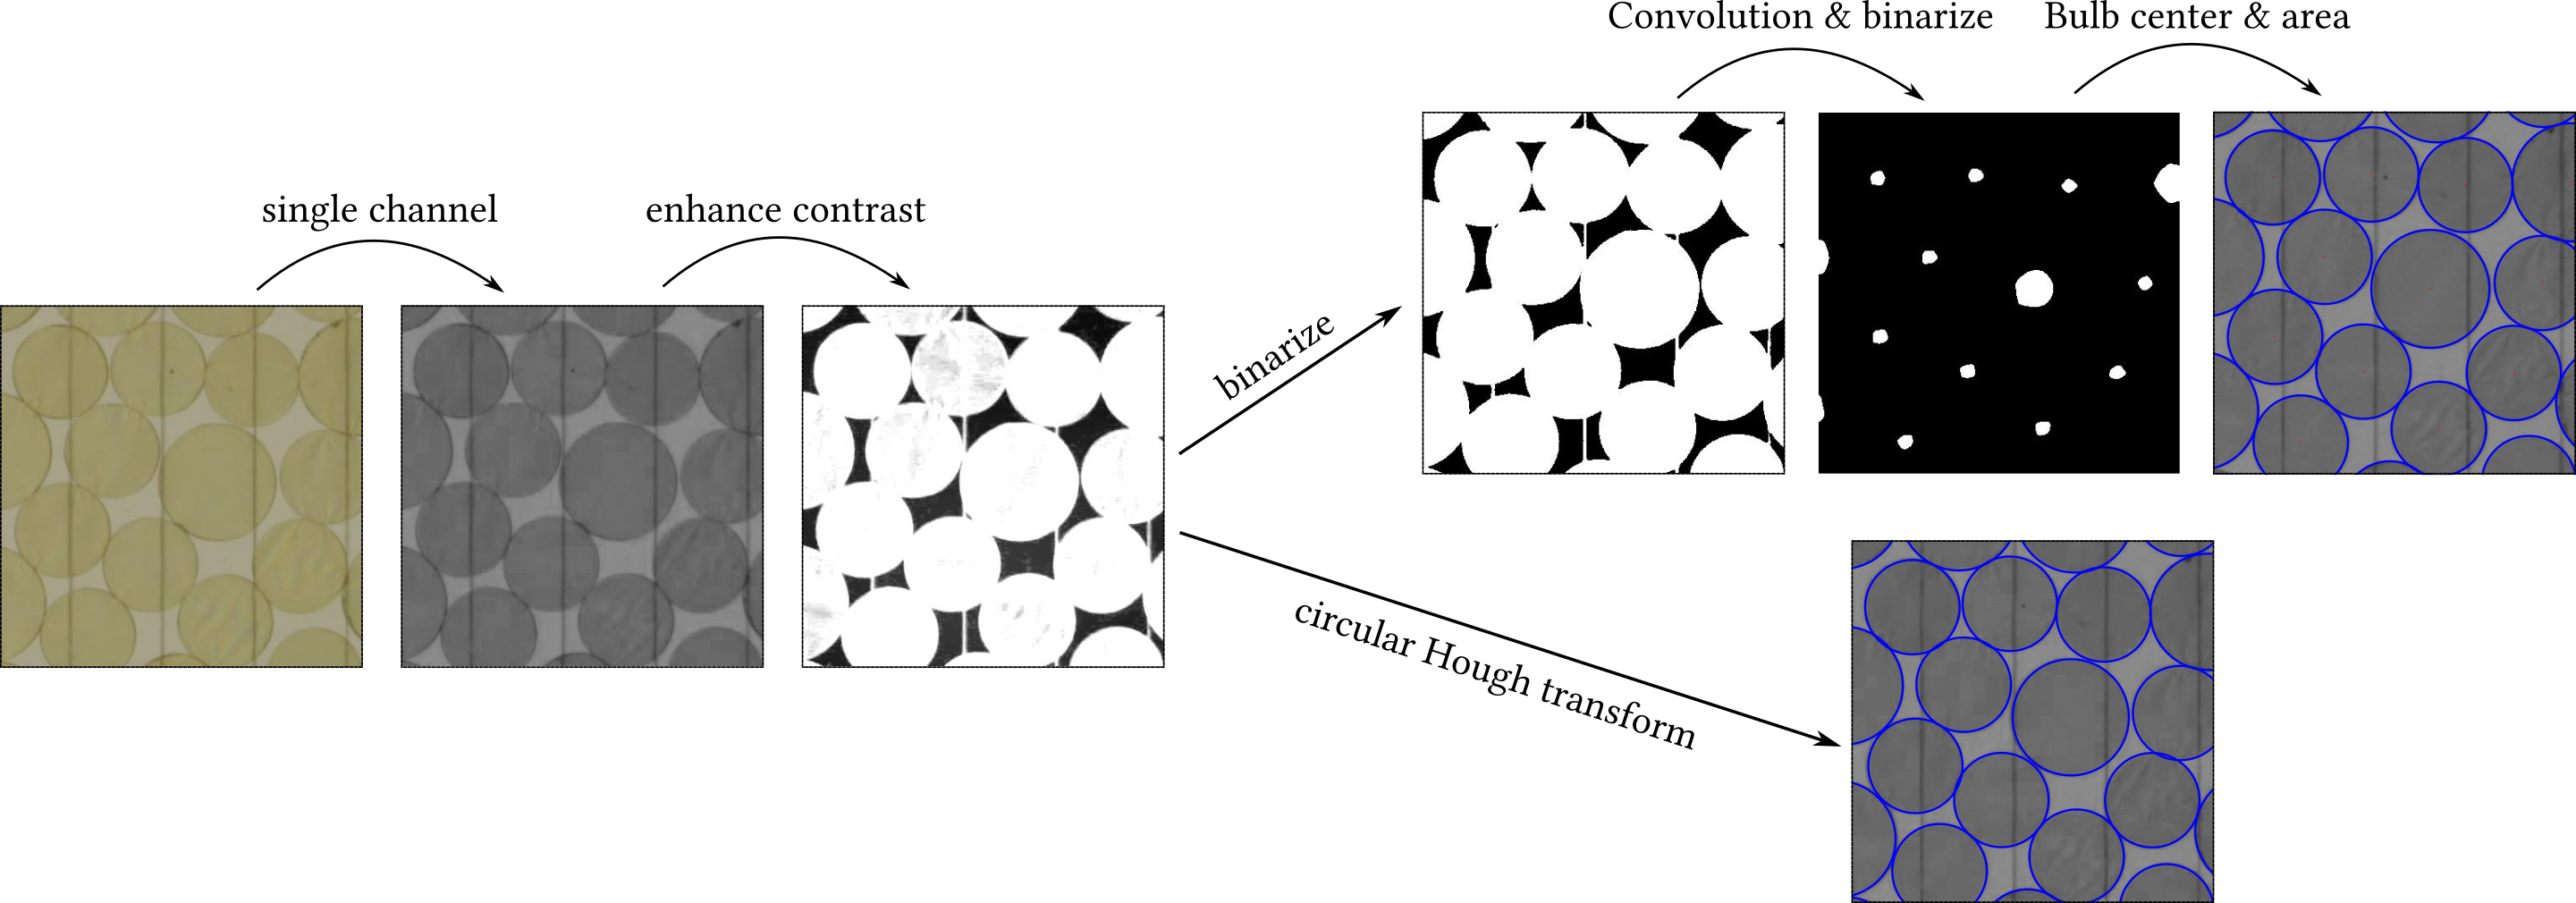
The convolution method is fast in computation but requires high-contrast images and has a low tolerance for light noises inside of particles. By contrast, the circular Hough transform method has a high tolerance for light noises inside of particles and is robust for particles that are deformed from a circular shape, however, is computationally expensive.
1.2 Detection of the particle's orientation UV light imaging
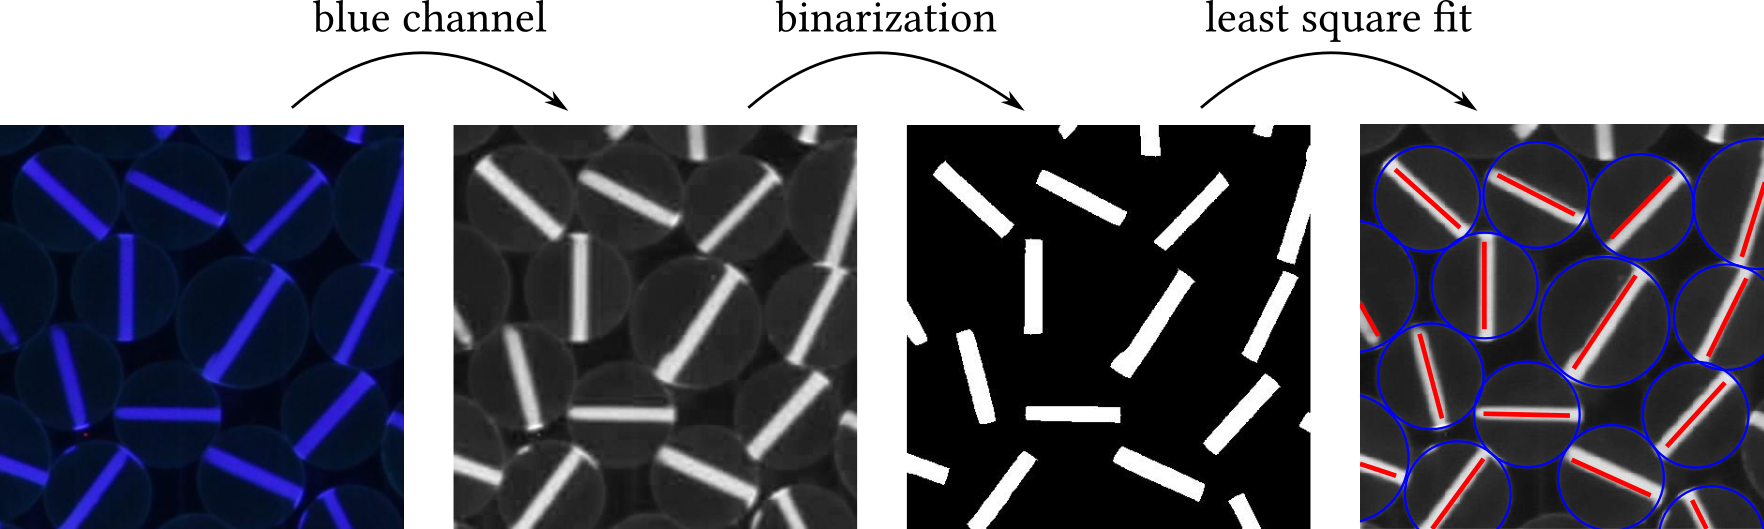
Due to particles being frictional in most experiments, particles will usually rotate if the granular system undergoes deformation. Hence tracking the rotation of particles is also important, which requires the knowledge of particle orientations. To achieve this, one can draw a bar with UV ink on the surface of the particle. This bar will leave no mark under white light, thus having no interference with the particle center detection process as introduced above. Once illuminated by UV light with white light off, only the UV bars are visible and can be recorded by a camera. Due to high contrast in this situation (blue for UV bars and black for background), the image can be easily binarized with Matlab function imbinarize so that the UV bars are 1 and the rest of the particle is 0. With previously determined particle center and diameter, each bar can be associated with its corresponding particle. With the positions of all the pixels inside the bar, the least squares fit with the minimized perpendicular offsets reveals a linear function between the x and y positions in each UV bar. The slope of the line gives the orientation associated with each particle. An example illustrating this procedure is shown below.
2 Tracking
2.1 Direct tracking
Once particle centers are detected, they can be tracked throughout the whole experiment. One efficient and accurate algorithm has been developed and integrated into an IDL by John Crocker, David Grier, and Eric Weeks. This method requires particle positions detected as input. The main idea of this method is: given the positions for all detected particles at a step, and possible new positions detected at the next step, the algorithm considers all possible identifications of all the old positions with the new positions, and chooses that identification which results in the minimal total squared displacement. Missing particles for a certain interval of steps are allowed. An exemplary result of tracking photo-elastic particles under simple shear after a certain amount of shear strain is shown below.
2.2 Measurement of the particle flow
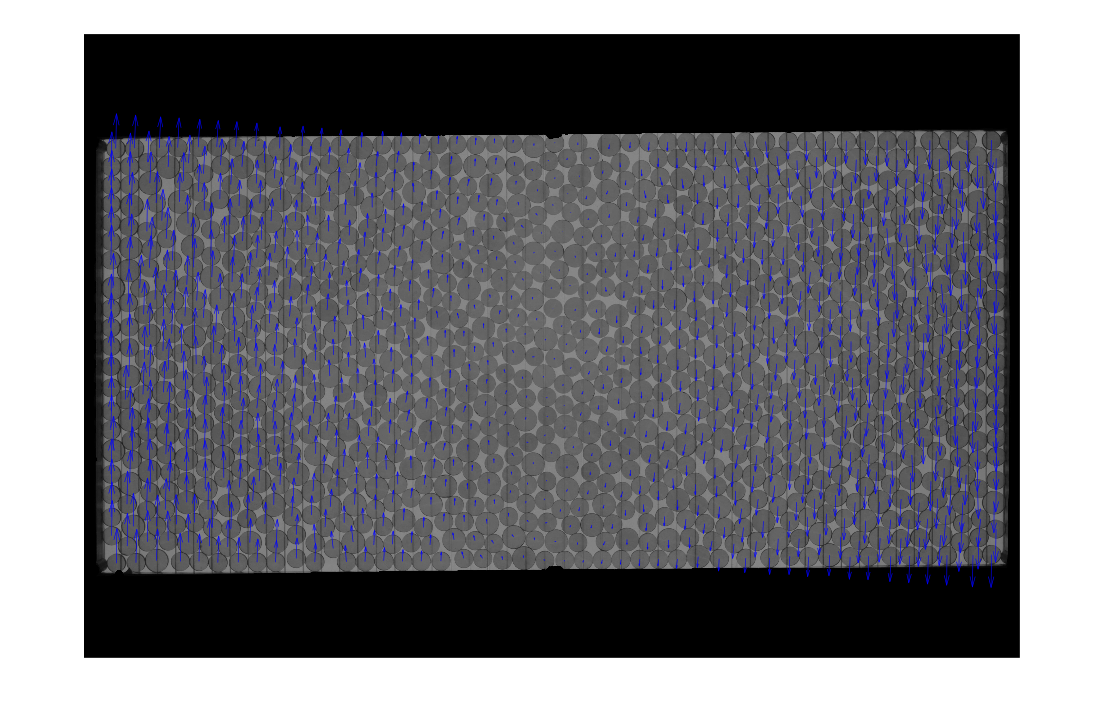
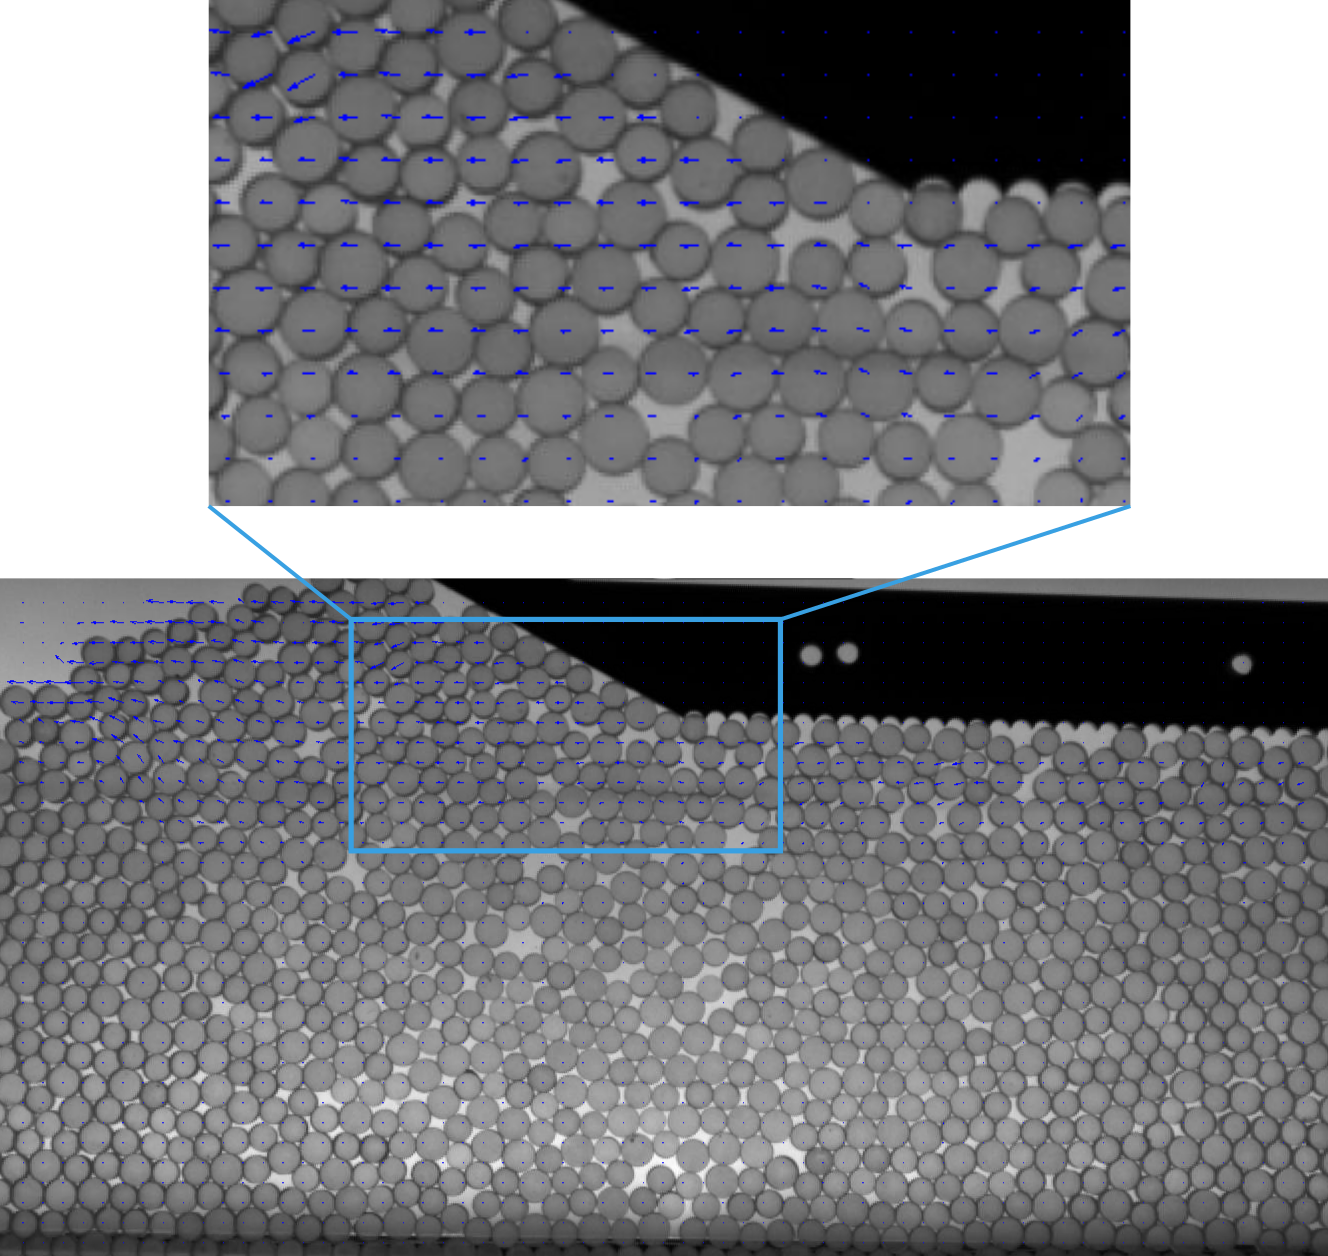
Low-resolution imaging does not allow particle detection and finding their positions. However, the displacement field of particles can be obtained using Particle Image Velocimetry (PIV). This method, by using correlations between neighboring cells in a coarse-grained grid, can calculate displacement fields between two images. The photo-elastic response images are not accurate enough for PIV. As the intensity of the image changes drastically locally, it becomes very noisy for PIV to calculate displacements. To achieve better precision, one uses normal light images (without polarizers)to extract particle trajectories. Several open-source packages in Matlab or other programming languages. The figure below shows a sample of PIV technique on unpolarized images. The blue arrows provide the displacement field of the granular medium under shear. The field represents data on a grid, showing the mean flow around the points. The grid size chosen here is about the size of smaller particles for better accuracy. This technique can be used to extract local time series and mean flow of particle movements.
- The trajectories of particles obtained by PIV on unpolarized light images of a sheared granular medium. Blue arrows show the magnitude and direction of the displacement field. The top image is an enlarged view of the bottom one:
[