Photoelatic image: gradient analysis
1. Overview
The gradient square method, or method, is an empirical measure used to estimate the stress from the photoelastic fringes. For a given photoelastic image, the value of gradient square for a particular pixel is defined as (taken from the PhD Thesis of T. S. Majmudar): And the value of for a region of interest (ROI) is where is the number of pixels inside the ROI. As an example, the top-left figure below shows an experimental image for a disc under diametric loading and the lower-left figure below shows the image calculated based on the experimental image. Both figures are colormap images: red means large value and blue means small value. For the image, the value of each pixel is the gradient square of the experimental image. The value for this disc is calculated by averaging the values inside the disc, which is the ROI of the problem.
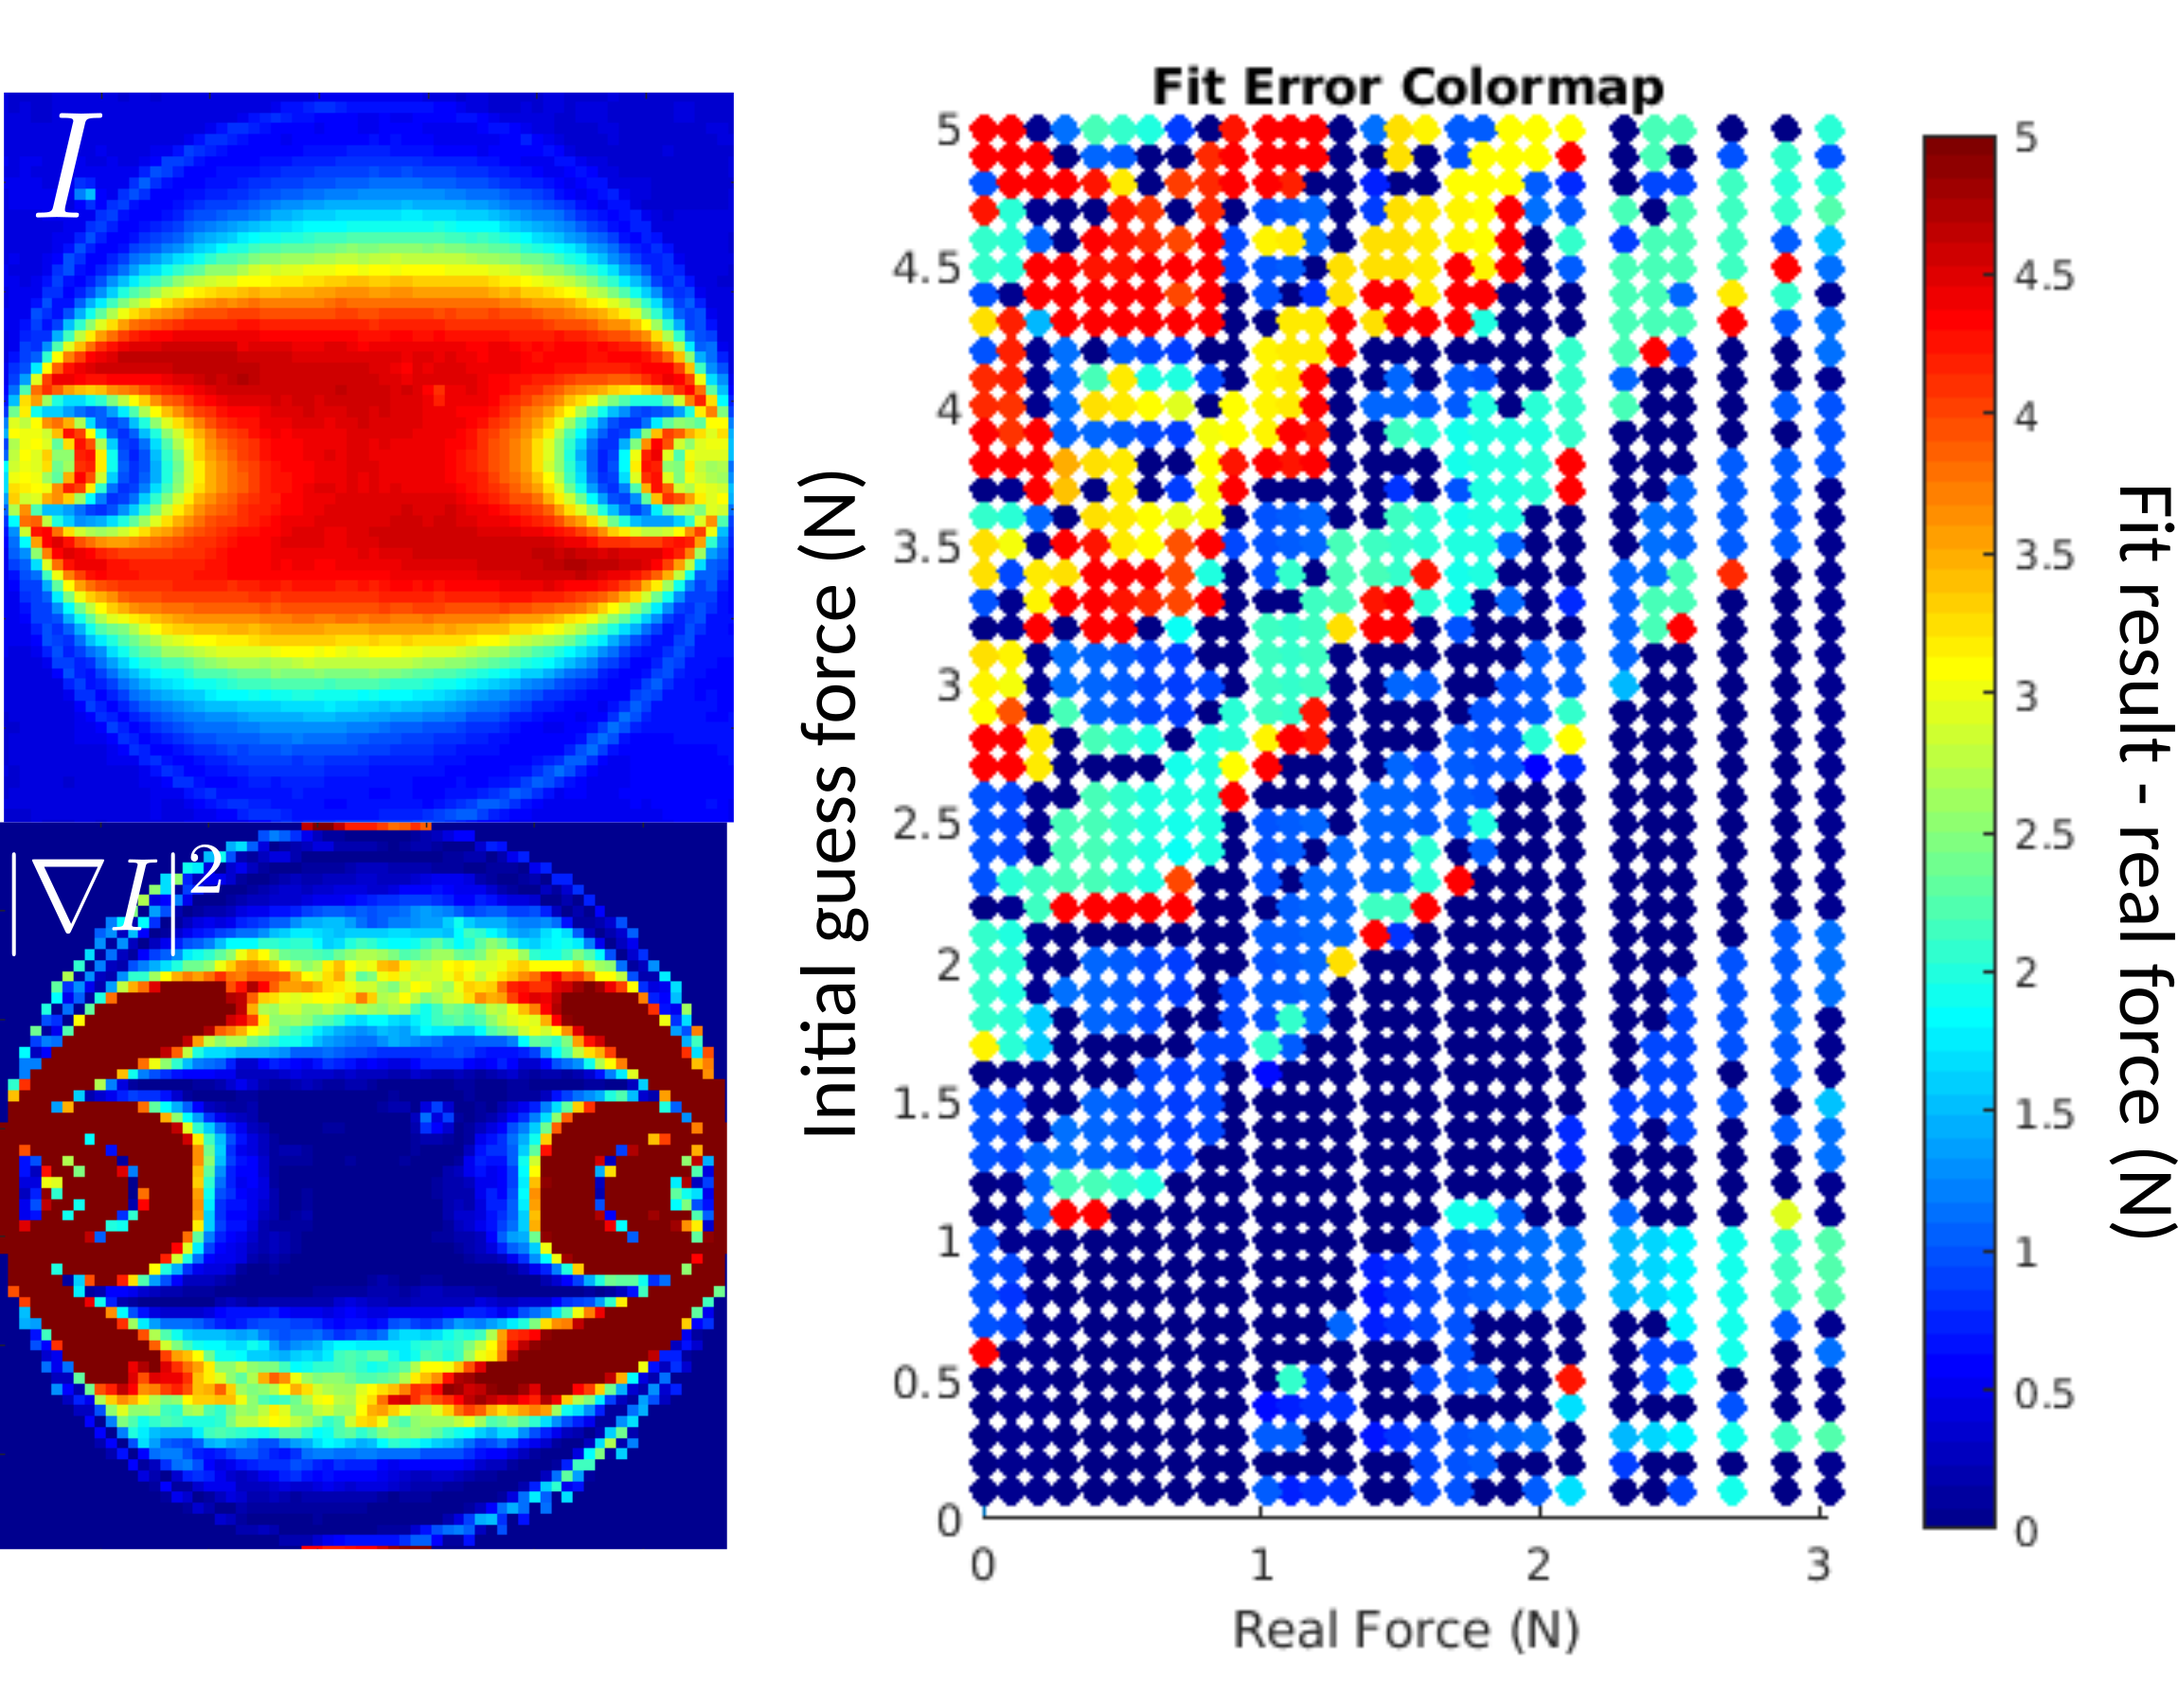
Although vector forces on contacts of discs can be solved by the nonlinear fitting algorithm, method remains a popular choice to estimate stress based on photoelastic fringes because the following reasons: (1) calculation runs much faster (2) works for relatively low resolutions and (3) does not rely on the initial guess of contact forces, which can be a problem for the vector force fitting algorithm. For example, the right figure above shows the fit error for diametrically loaded disc under different loading force (real force) and using different initial guess force for the nonlinear force fitting algorithm. It is clear that only when the gauss force is close to the real force that the fitting algorithm gives accurate results.
2. Global scale stress indicator: boundary pressure
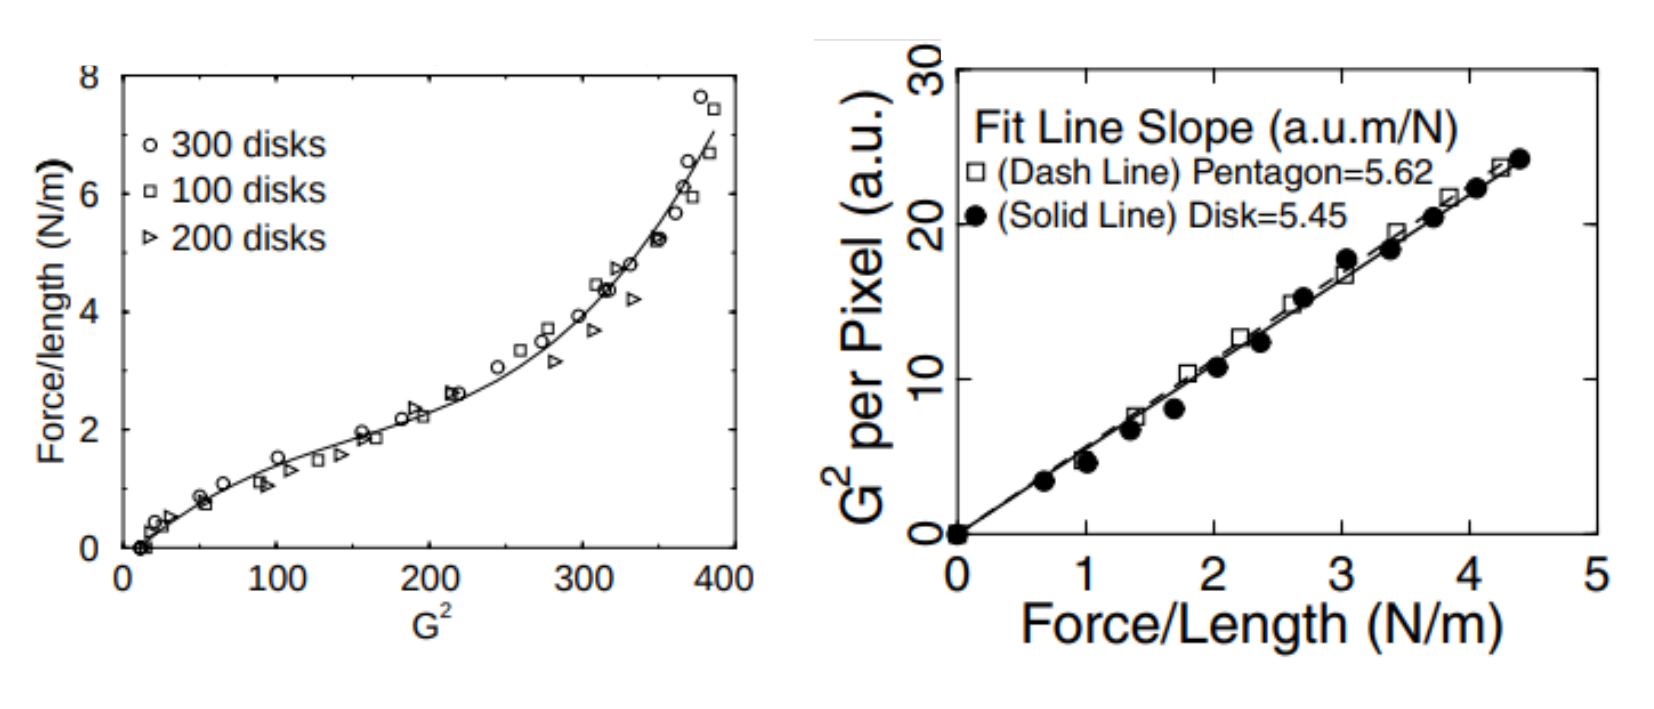
On global scale, calibrations show that depends linearly on boundary pressure for moderately large boundary forces. The left figure below shows a calibration by D. Howell et al. and the right figure below shows a calibration by Geng et al.. Both calibrations show that there exist a range of pressure where depends linearly on pressure. In particular, the right figure show that the linear dependence works also for pentagon shape particles. However, the relation between the boundary pressure and the value of is highly empirical. So a calibration test should be made for any particular experiment instead of just using published calibration results.
3. Particle scale stress indicator: sum of force magnitude
3.1. Comparison between and light intensity
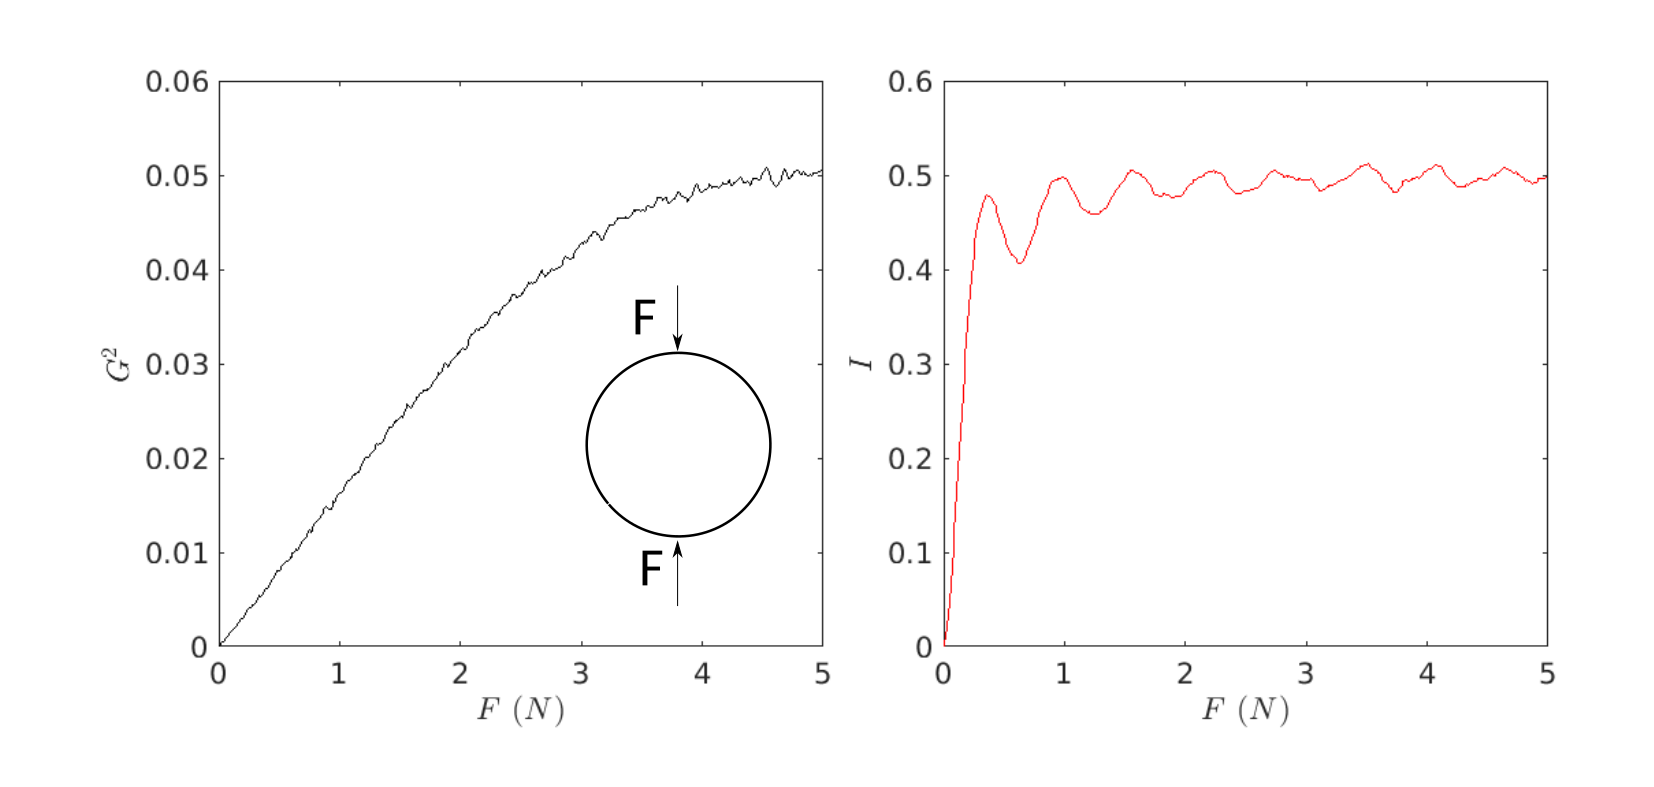
On single particle scale, is shown to be proportional to the summation of the magnitudes of the contact forces acting on the particle [4]. can measure larger forces than the intensity measurement when the resolution is high enough. The figure below show the evolution of and average light intensity inside a numerical simulated disc. The horizontal axis is the diametric loading force. It is clear that saturates at a much larger force than the average light intensity . So is a better stress indicator at particle scale than if the resolution is not extremely low.
3.2. Large tangential forces
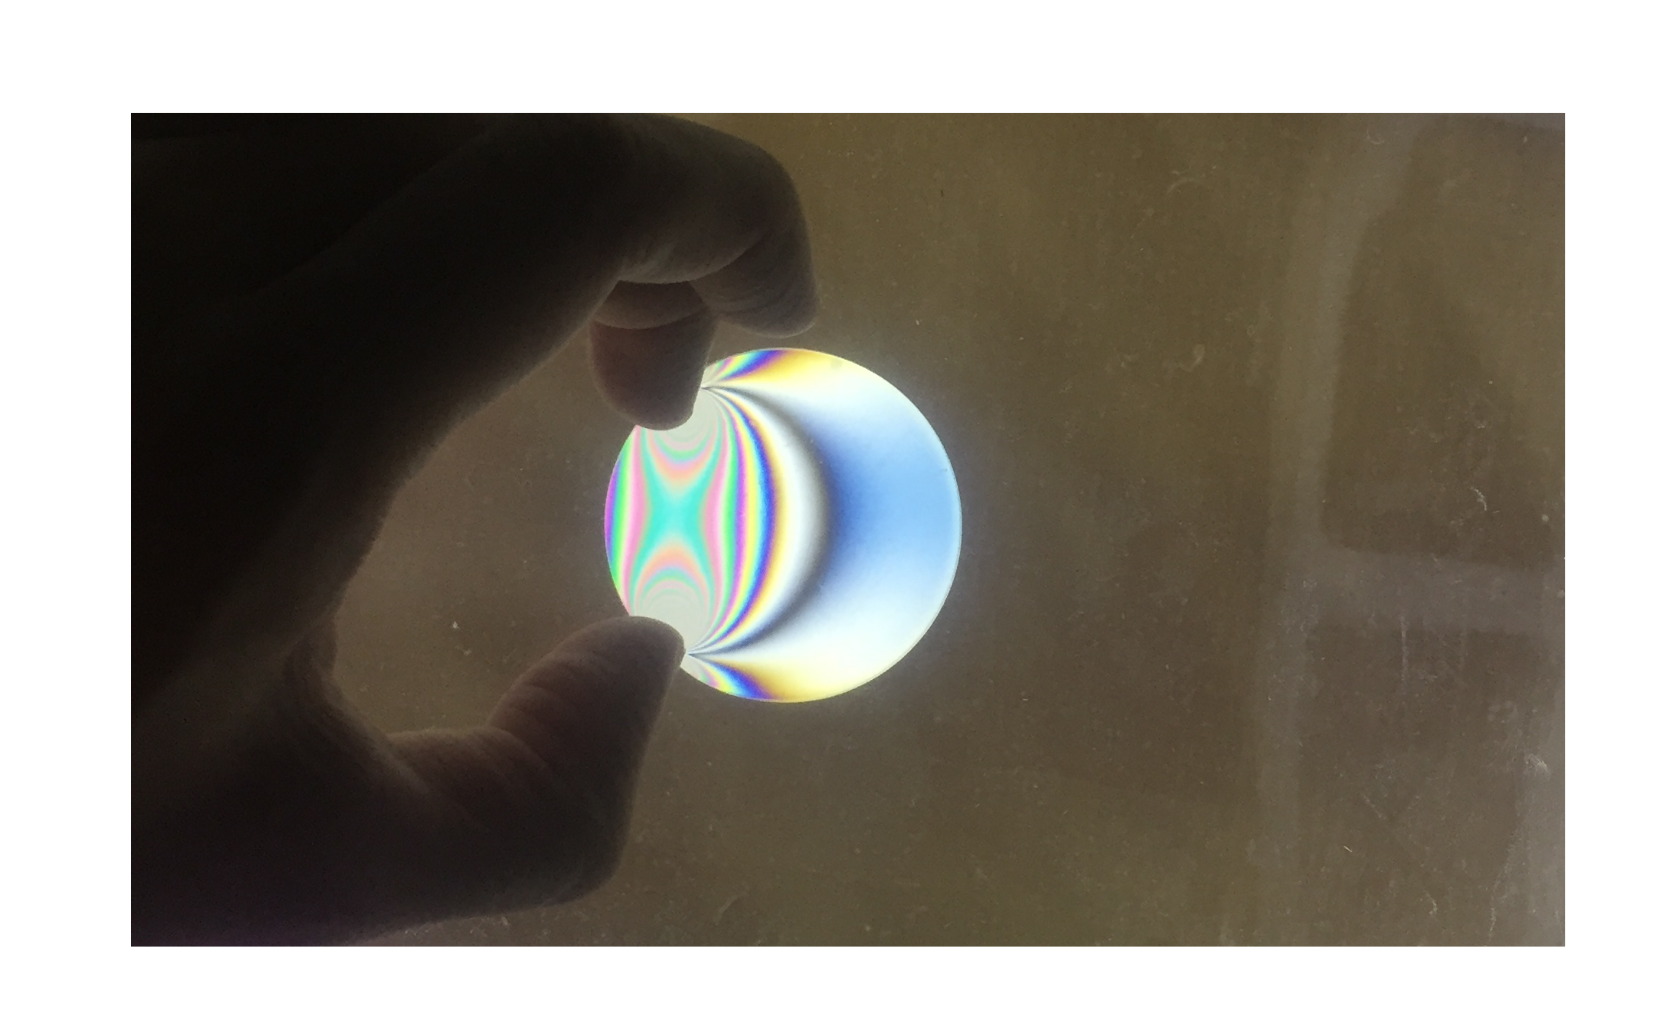
For diametric loaded disc, is proportional to the disc boundary pressure. However, if the tangential contact forces are large, then is not proportional to the particle boundary pressure. Instead is proportional to the sum of the contact force magnitude [4]. However, for real discs with friction coefficient , experimental tests show that can still be regarded as pressure indicator on particle scale within experimental noise, because the tangential forces can not be vary large. The figure below shows an example photoelastic response for a disc when the tangential force is very large, where no longer mesures particle boundary pressure.
3.3. Experimental parameters that change the dependence between and the contact forces
The slope of the linear dependence between the and the sum of contact force magnitude depends on many parameters: (1) The background light intensity . (2) The stress-optic coefficient . (3) The radius of the disc . (4) The resolution defined as the number of pixels per meter. Theoretical derivations, supported by numerical and experimental tests, show . A first intuition from this result is, in polydisperse system, the relation between and contact forces for particles with different sizes must be calibrated separately. [4]
3.4. Contact type influence
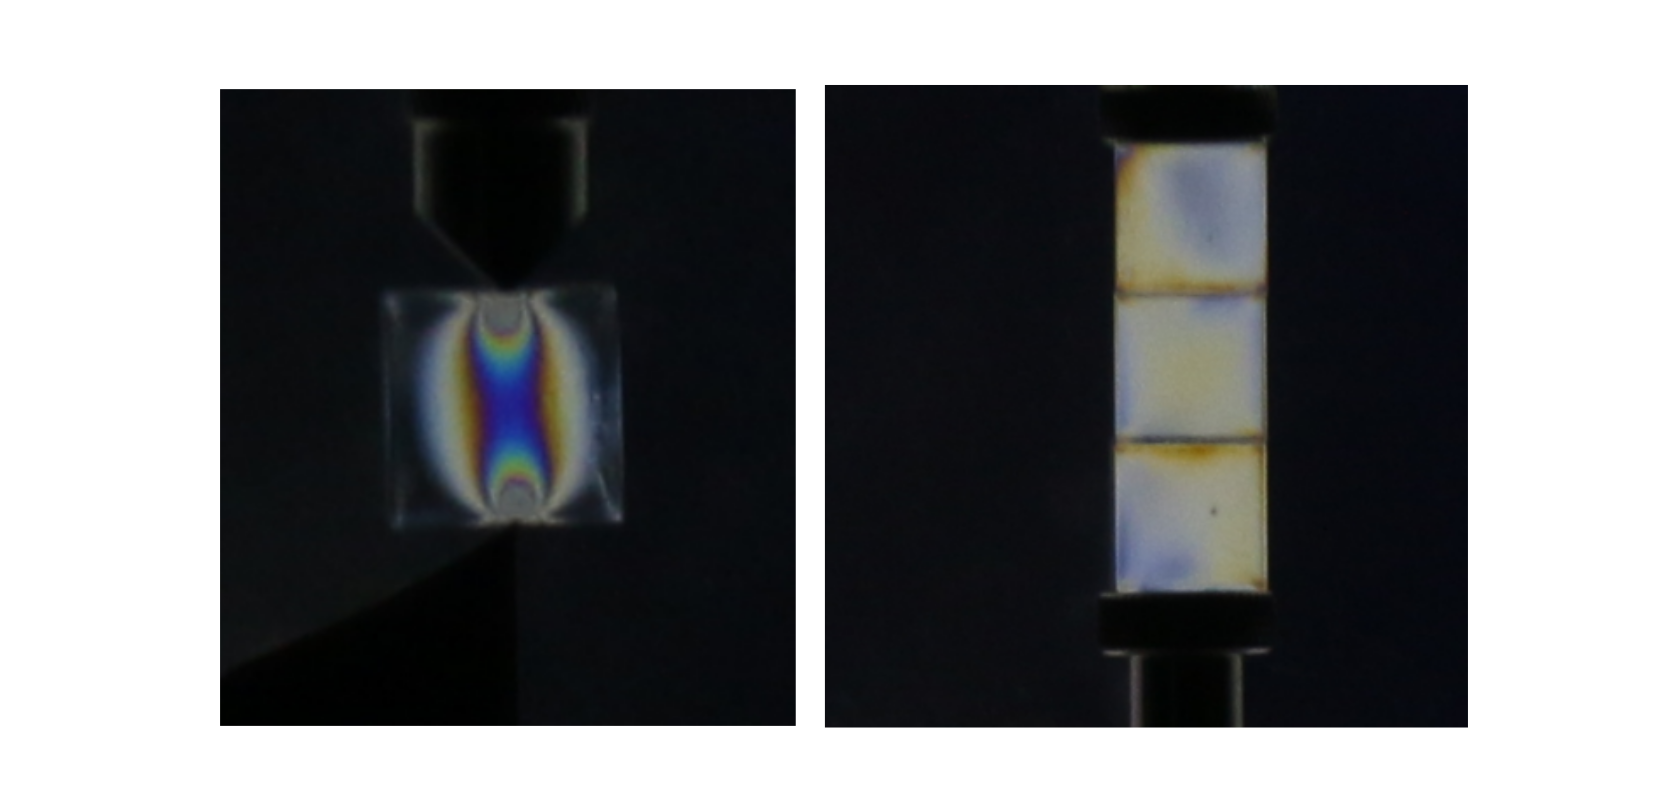
The discussion so far only considered disc particles. An unproved empirical expectation is for particles with only point contacts the linear dependence between and contact forces on particle scale should still hold. However, when contact with finite area occurs, the value no longer uniquely determined by the contact forces. An example is shown in the figure below, where a square shape particle is under point-point diametric load (left) or surface-surface diametric load (right). The magnitude of the contact forces are same for both cases. But the photoelastic patterns are very different, resulting in different value.
4. Reference and further readings
[4] Yiqiu Zhao et al., 2019 New J. Phys. 21 023009
[