Photoelatic images: intensity analysis
The fringe pattern, which is due to the internal varying stress structure of particles, can be calculated using theory of elasticity. The contact forces can be obtained using this pattern at the points of contact. In many similar experiments, a spatial derivative of image intensity is used to retrieve local stresses. This method requires high-resolution imaging of the media of order of 100 pixels per particle diameter in order to distinguish fringes. High-resolution imaging is currently possible only by using quasi-static imaging. However, studying fast dynamics such as impact, rheology, or stick-slip requires high-speed imaging and limits the resolution. Consequently, the fringes are not clear enough to be used for calculation and the noise may dominate the calculation. As an alternative, image intensity can be used to quantify internal stress.
Experimental evaluation
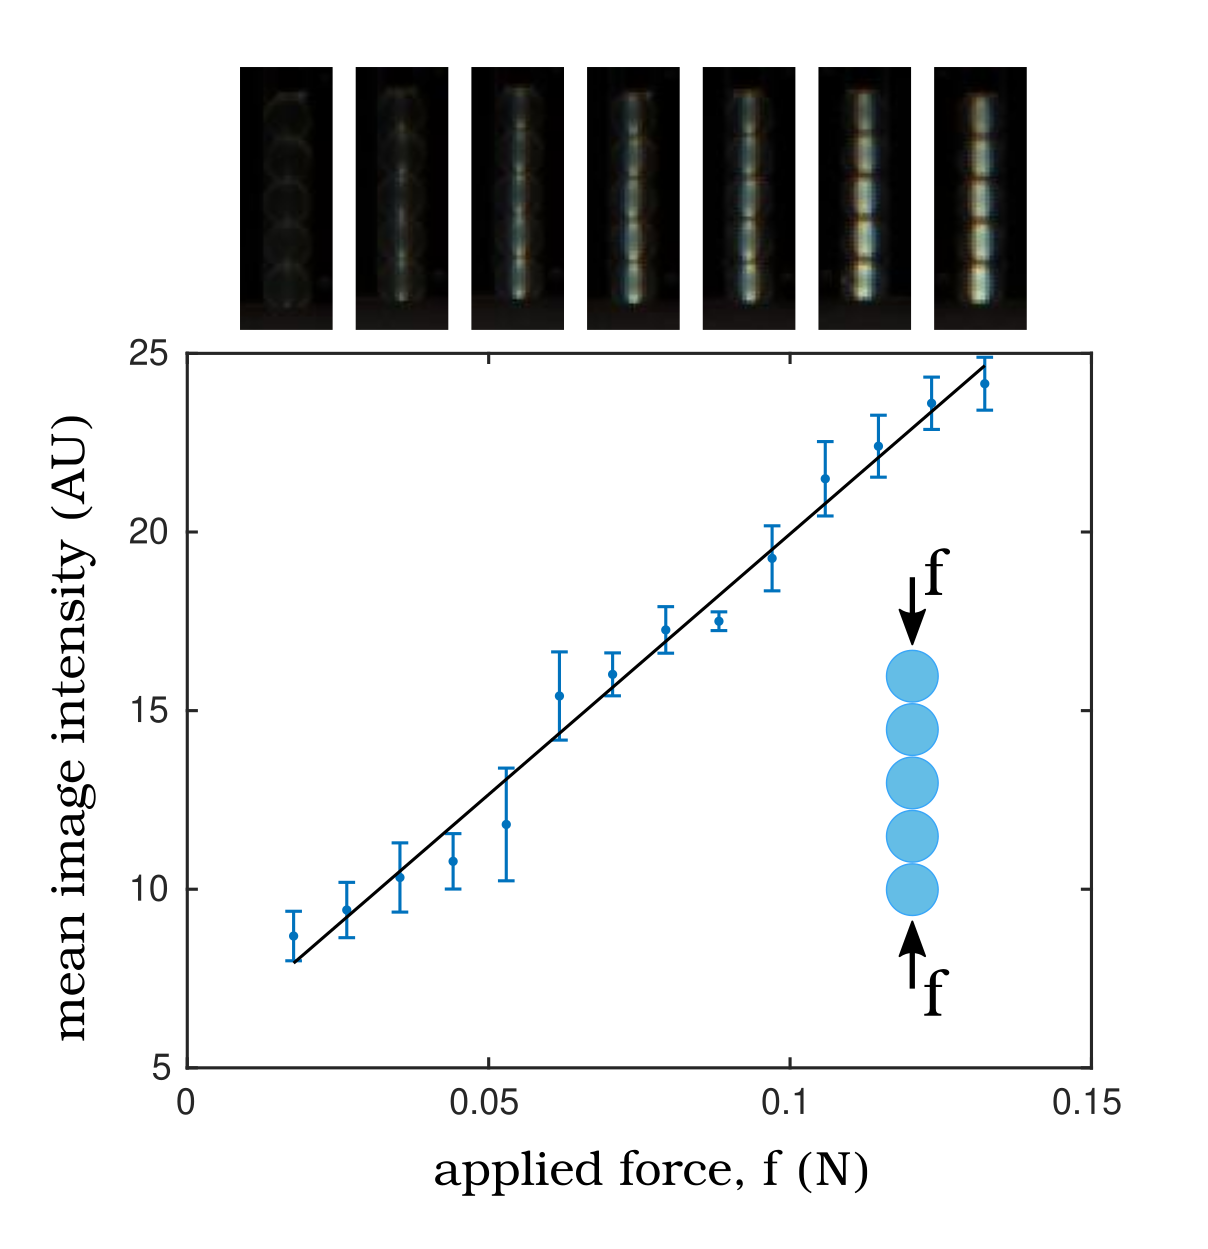
The relation between image intensity and externally applied stress can be empirically evaluated. The figure below presents the calibration relation for a small chain of five particles as a function of applied external force. The mean image intensity increases linearly with the applied force, showing that image intensity is a measure of pressure in circular particles.
- Experimental calibration curve of mean image intensity for a chain of five photo-elastic disks under applied force, f. Images, corresponding to different forces, are shown at the top of the diagram. The linear relation shows that image intensity can be used as a measure of pressure in the circular particles. The error bars are standard deviation on mean with three measurements for each data point:
Numerical evaluation
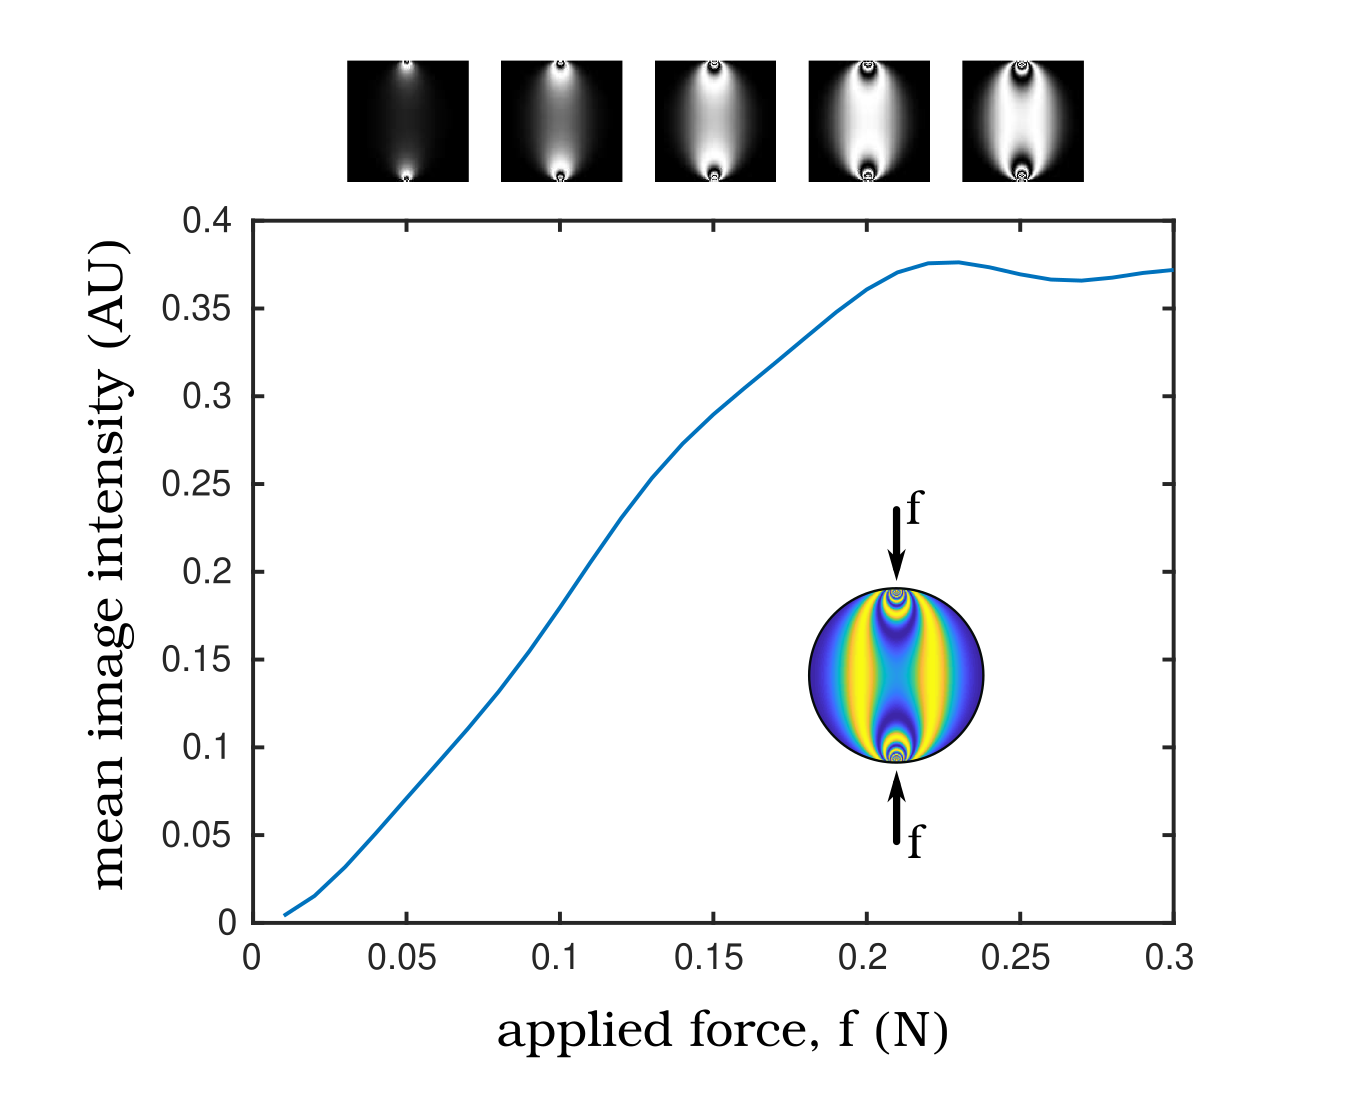
In principle it is possible to analytically find a closed form for the Cauchy stress tensor inside a disk, and consequently, aggregated intensity. The closed form is rather complicated to derive. However, using the same principles, we numerically solve for stress inside a disk and solve for local intensity. The figure below presents the calibration curve using numerical simulation. The curve is derived using a simulation of a single disk internal stress from 20 pixels-wide images, similar to the experimental resolution. If the force is small, it is linearly related to the mean intensity of the image. Mean intensity reaches a flat plateau for large forces as more fringes appear.
- Numerical simulation of mean image intensity for photo-elastic disks under applied force, f. Images, corresponding to different forces, are shown at the top of the diagram. The curve shows that image intensity can be used as a measure for the pressure in disks up to a threshold. Inset presents a heatmap of intensity inside a particle:
Local energy calculation
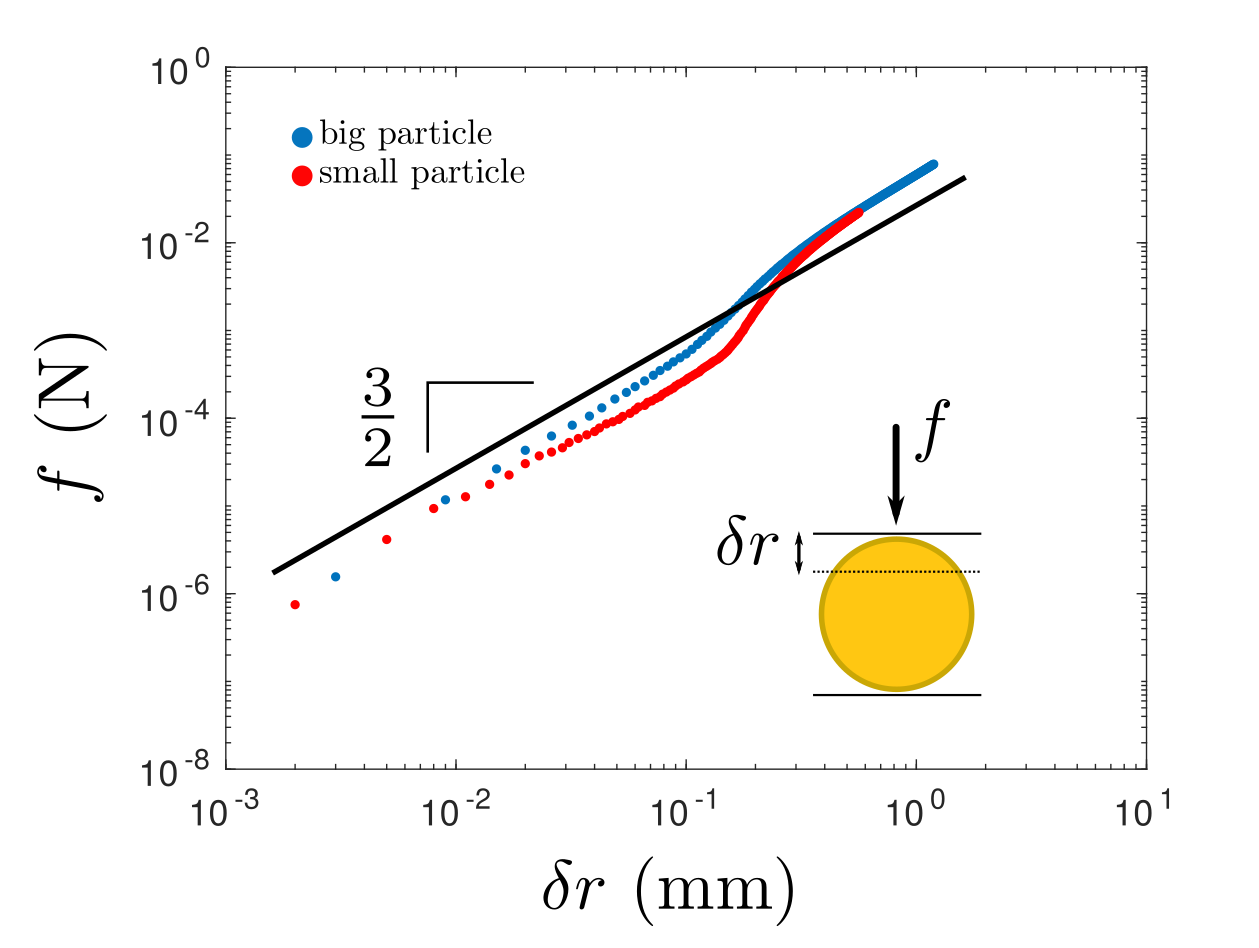
To relate intensity with local energy, we need to know the scaling of the force with particle deformation. The figure below experimentally investigates this relation for the sample circular particles. The relation shows a great fit with Hertzian contact force, , as expected in circular particles. Combining Hertzian force relation and the linear relation of force and mean image intensity for a single particle, we can deduce that: in which is the stored energy in the particle, is the displacement at the point of force contact, and is the average intensity in a single particle, and represents the change in them. This equation establishes a relation between local image intensity and local energy in the granular medium that can be used to extract local energy information.
- Stress-strain relation for a single particle as measured experimentally. Blue and red data points correspond to two sizes of particles. The scaling shows a great match with the Hertzian contact prediction:
Collective behavior
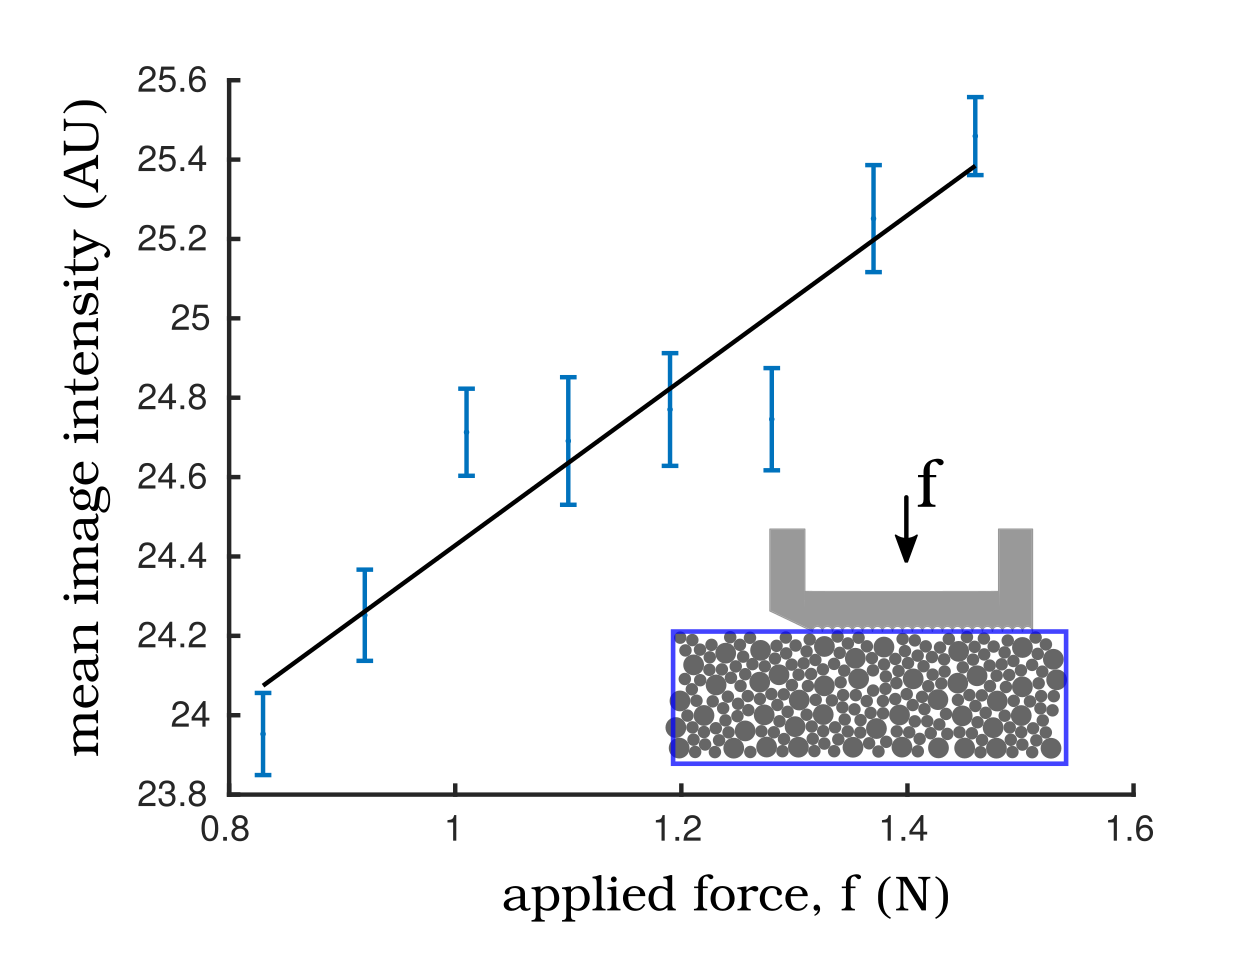
We can also investigate the collective behavior of granular packing under external normal force. As shown in the figure below, image intensity is linearly dependent on applied force; however, with a smaller correlation compared to single force chain calibration. This difference is due to the fact that in packing there are many stable configurations with different contact force networks that result in different mean image intensities for similar external force.
- Experimental calibration curve of mean image intensity for a disordered packing of photo-elastic disks under applied force, f. The linear relation shows that image intensity can be used as a measure for bulk pressure in the packing. The error bars are standard deviation:
Force chain network using ridge filter
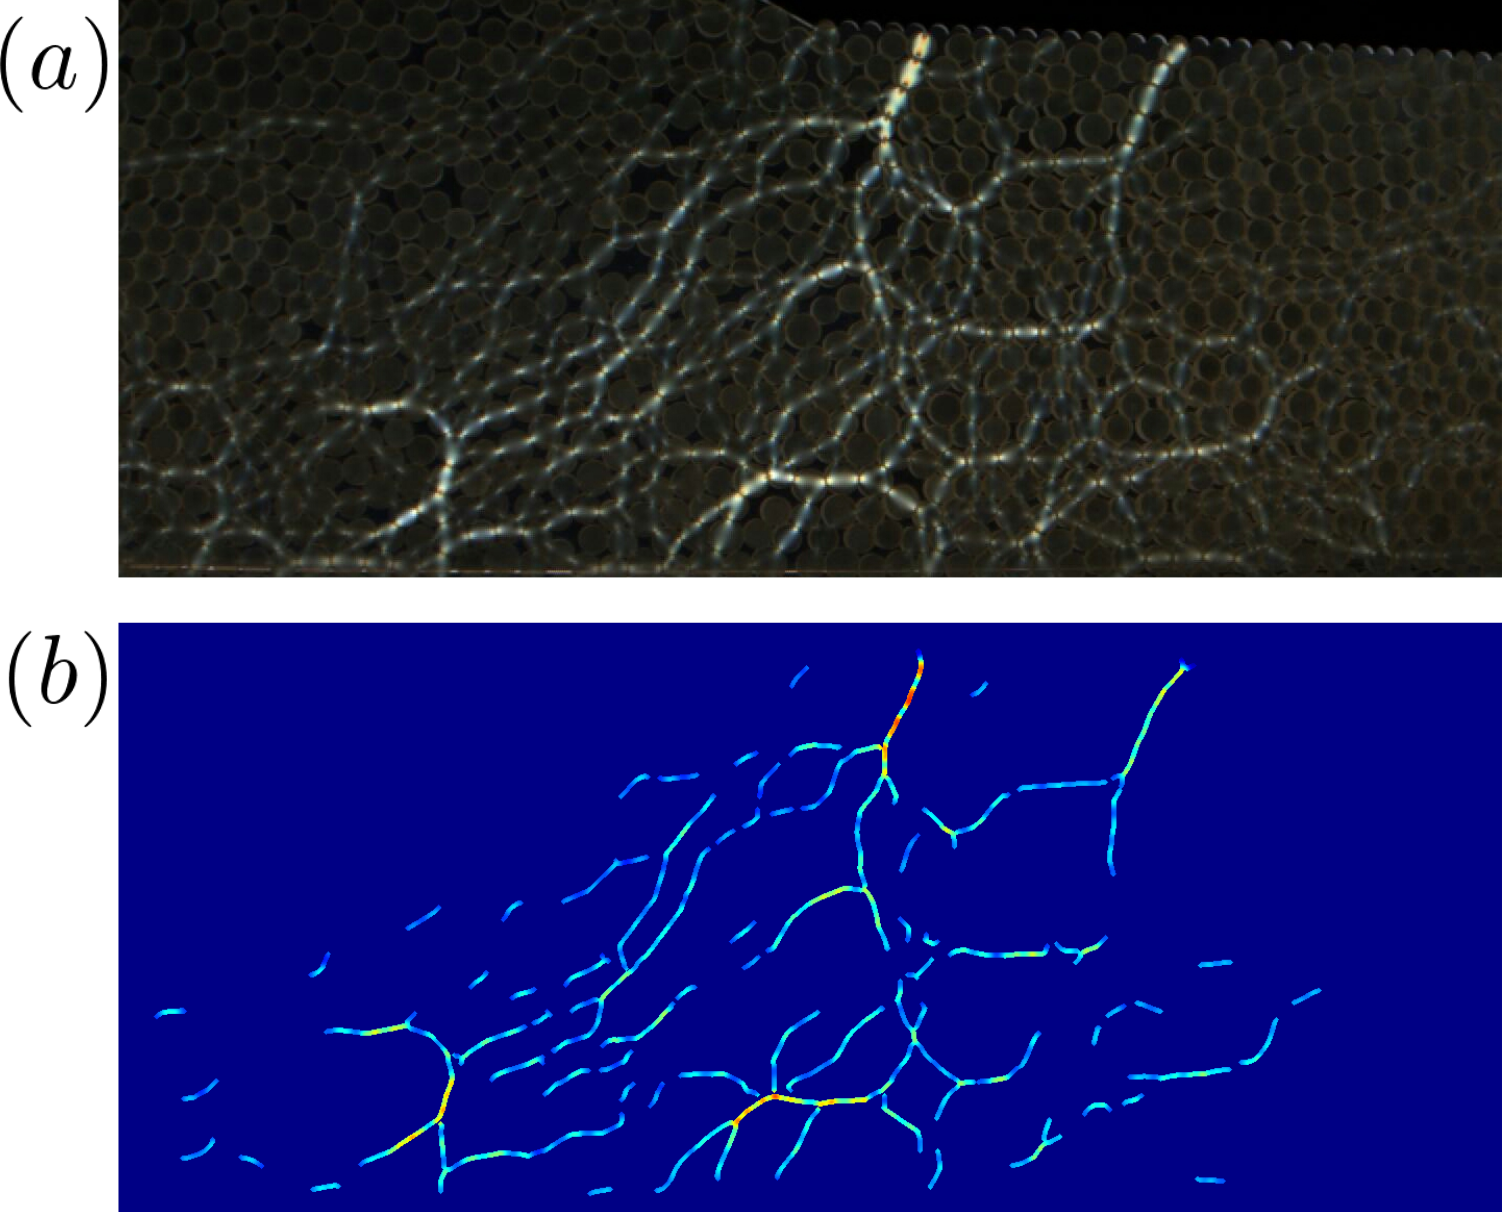
Many methods can be used to construct the force chain network from polarized images. For low-resolution imaging, where individual contacts are not detectable, one can use a specific filter called ridge detection. The ridge filter uses a gradient of a smoothed version of the image to find the maxima of intensities. These maxima correspond to force chains. Using the gradient, one can also find the direction of the force chains. Ridge filter can be implemented in Matlab, Python, or using builtin function in Mathematica. The figure below shows a sample image with ridge detection on it. The color represents the intensity of the image from blue being black to red being white. With this filter, all background noise from particle edges can be removed and the network structure can be constructed more easily.
- Showing force chain using ridge filter. a) A raw polarized image from the experiment. b) Processed image using ridge filter and color-coded with image intensity. Blue to red corresponds to black to white respectively, showing the force chain strength:
[